Lean is a management philosophy and improvement methodology that is applicable in any organization or industry. Even in the non-transactional, low-volume and high-variation world that is professional services, Lean provides both the framework and an approach for empowering people to drive increased quality rigorously. Although the knowledge industry, which author Jim Benson famously remarks, “Ain’t got no gemba,” is no exception, the road is much less paved than in other veteran markets such as manufacturing or healthcare.
Array has been on our Lean journey for a few years. Our path has been shaped and scarred by the typical successes and stumbling blocks of any organization venturing to radically reshape its thinking. We have stories of what has gone right and four times as many examples of what hasn’t worked for us (even though it worked well in healthcare, or manufacturing, or the customer service industry). One of our cornerstone struggles is in measurement. Although we acknowledge that our work is not transactional and the flow is wildly dependent on many factors we don’t control, we still can’t know if our improvements are, in fact, improving anything if we can’t measure ourselves.
Our early Lean experiments involved a number of desperate attempts at measuring our performance at a daily or weekly interval. Most of them ultimately failed. They were grasps at the straws of our transactional brethren. We had to face that our work is not inherently visible. It happens in the minds of our staff, across conference room tables, and increasingly via skype and e-mail. But then we had a few breakthroughs:
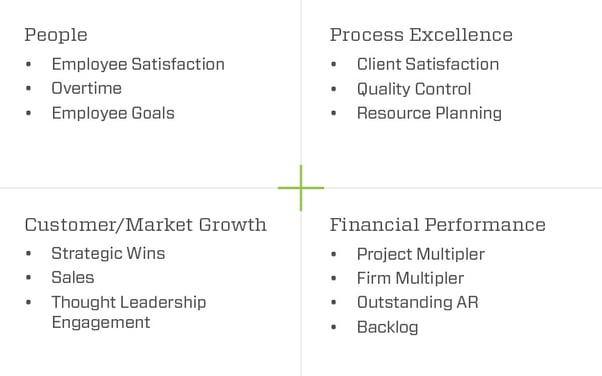
- We adjusted our focus. Instead of emphasizing the things we could easily measure, we asked ourselves what we needed to measure to gauge the progress we wanted to make. Our improvement is centered around our balanced scorecard of People, Process Excellence, Customer / Market Growth, and Financial Performance - so we looked for things to measure in each of those areas. This wasn’t easy. Some of these quadrants had no obvious quantifiable metrics.
- We mapped our value stream and were blown away by the mess of IT systems and platforms in use across our relatively small organization. Data was everywhere, but most of it didn’t interface with the rest of it. You couldn’t get solid info that was multi-disciplinary easily, if at all. We were asking leaders to make business decisions with partial pictures at best.
- We realized we needed to make it visual. While the work isn’t easily visible, the information about performance could be. The Lean principle of jidoka applied to us just as it does to any organization and we could do much better in this area. Leaders and project teams alike were unable to have productive conversations about problem identification and resolution because they didn’t have universally available information. If we were going to use any of this mountain of data we were collecting, we had to integrate and focus it visually.
- There are no good industry benchmarks for the professional services. Finding like organizations is so difficult that comparisons are easily dismissed. Our work isn’t transactional, but it's still a process, and a process can be measured and graphed. We can be our own benchmark – and that is probably all that matters as we work to improve ourselves. Donald Wheeler provides numerous examples in his book Understanding Variation of organizations, applying statistical process control charts to business data.
 After a few years we have developed a series of Key Performance Indicators (KPIs) we can measure that reflect our goals. There are KPIs in each of our key focus areas. We have experimented with graphing them as control charts. It was humbling. In many cases the problems we felt and knew anecdotally were painful to see indisputably in black and white.
While it was sobering to see the unpredictable nature of many of our processes, it was powerful. We saw one area that directly benefited from an improvement we implemented as a pilot a few months prior. It was clear this needed to be deployed across the firm. We also saw a problem we’ve know about for some time clearly described as wildly out of control. There was instant consensus among the leadership team that this had to be addressed. It was no longer a question of opinion or priority.
As a final step, we are integrating our data platforms with Qlik Sense to create dashboards that visualize the information in real-time (which is only monthly for most KPIs) and makes them available across the orginization. Our leadership huddles will now focus on these KPIs and the direct business actions we can take to bring them into control and improve them. This measurement work doesn’t inherently improve our firm, but it is the first critical step in understanding our problems.
We no longer don’t know what we don’t know.

