In today’s fast-pace, evolving world people are constantly looking for a faster, more efficient way to receive and register information. Everyday people are creating applications, graphic information and new technologies to make such efficiencies possible. Now, the most common and more popular way to receive information faster is by utilizing infographics. Within the last five years, society has transitioned from wordy documents to flat, bold infographics. This recent trend in graphics has made an impactful impression on today’s businesses, which now recognize the value of infographics.
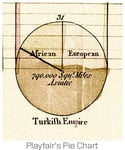
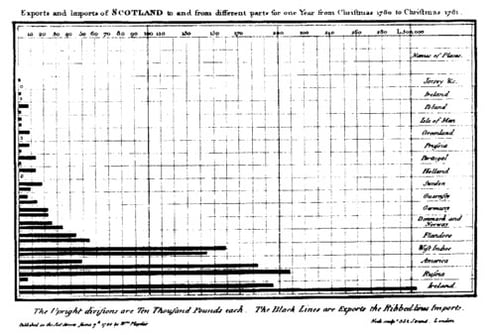
Infographics date back to the Stone Age when cave people used natural substances from the earth to draw hieroglyphics of animals, people, food and other depictions on the inside of cave walls. Many credit William Playfair for inventing the first bar, line and pie charts in the late 1700s. He argued that observing information in the form of a chart as opposed to a table was more understandable and easier to read. A few centuries later in 1933, Harry Beck created the first map of the London Underground Tube showing only color-coded lines to depict public routs. This brought infographics into everyday life, opening up a world of graphic possibilities.

In the 1990s, translated data, charts and infographics became a big hit - especially in the business and marketing industries - to show progression throughout the workforce. Today you can find infographics everywhere. Most recently, infographics have escalated from useful pieces of information to downright creative art pieces. Infographics are now commonly themed to their topic or company brand, giving more of an allure and sense of consistency when used. This makes them more-quickly defined and relatable to their purpose.
Because people consume more information now than they did 50 years ago, their brains need a break from all of the words seen and read on a daily basis. Infographics have the ability to give people’s brains a break from information overload by making information easy and fun to read.
Making their mark in the work force and business industry, infographics have taken the presentation world by storm and turned boring slides into engaging elements that provoke conversation. However, the conference room is not the only place we find them. In recent years, people and graphic artists have taken into account aspects such as color, shapes, type, and organization to produce the most successful infographics. We find these infographics in resumes, proposals and break rooms, as well as on blogs and company websites. Outside of the business world, infographics have made a big movement in the art and programming communities. Infographics can be found anywhere on any subject, from movies to wind currents in the United States. There are many varieties of software that are used to transform data into appealing graphics such as Microsoft Office products, Tableau, Adobe Numbers and many others.

The current trends and fads of graphic design dictate the styles of infographics, which are dominating the world’s data and popping up everywhere. The future of infographics is promising since the graphic trends will continue to carry over as technology progresses. Over time, they will become more interactive, creating compelling stories that people easily relate to and comprehend.
This blog was written by a former graphic designer with Array, Jessie McNeese.

